

Lesson Plan: Unit - 02 Microsoft Office

Subject: BELE2CFA: Computer Fundamentals And Applications
Topic of Study: Pivot table and Chart with its options
Grade/Level: Bachelor of SCIENCE
Objective: To demonstrate and explain create / modify steps of pivot table and charts options.
18.0 Pivot table
- It is a special kind of table which is used to summarize the result in easy and customize format.
- How to work with pivot table.
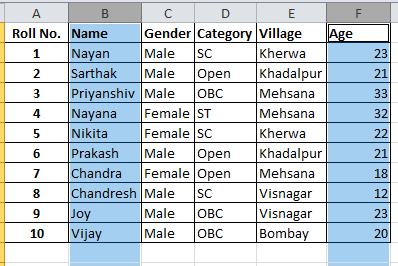
- Step 01: Ready with following data and select all.

- Step 02: Click on Insert menu and select the pivot table > pivot table option

- Step 03: It will display dialog box and Click on OK

- Step 04: Now, it will create a new worksheet and it will look like this.

- Step 05: Select or tick mark fields that you want to add into pivot table. for Example: Select the Roll No. fields.


- Step 06: in Values box, you can change it different kind of operations as per your pivot table need.
- Step 06.01: Click on it and Select the value field settings.

- Step 06.02: Change the formula options and see the output.

- Step 07:Now, click on Gender fields from add to report box. (automatically, it will add into Row labels) and see the output like this.

- Step 08: Now, click on Category fields from add to report box. (automatically, it will add into Row labels) and see the output like this.

- Step 09: Now, drag and drop the Village field into Column Labels and see the magic of output.

18.1 Chart
- It is a special features to display a data into form of graphical manner.
- It is easy to interpret.
- Parts of charts

- A : Y Axis
- B : Grid Lines
- C : Data Series
- D : Y Axis Value
- E : X Axis Value
- F : X Axis
- G : Legend
- H : Chart Title
- I : Chart Area
- Types of chart

- How to create chart.
- Step 01: Select the all columns or any two or more column using CTRL key.
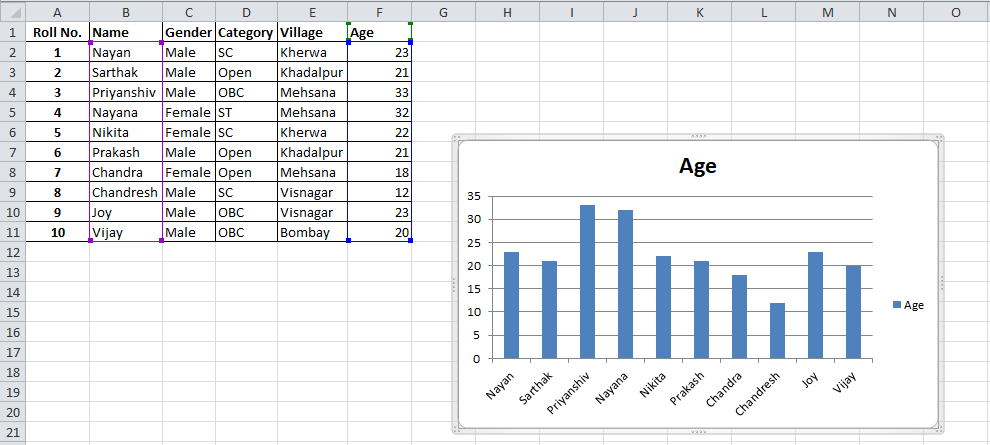
- Step 02: Click on insert menu > Column > Clustered column option.

- Step 03: See the output.
- How to change chart type
- Step 01: Click on Change Chart type option at Left Hand Side (First)

- Step 02: Select the appropriate chart type (for Example: bar)

- Step 03: See the output.

- How to switch row / column
- Step 01: Click on Switch row / column.

- Step 02: See the output.

- How to change chart's layout
- Step 01: Click on Chart layout option and select number 2 layout.

- Step 02: See the output.

- How to change chart's design.
- Step 01: Click on Chart style and click on style number 03.

- Step 02: see the output.

Tags:
Pivot Table and Char